Decoding of categories, Statistics by status:
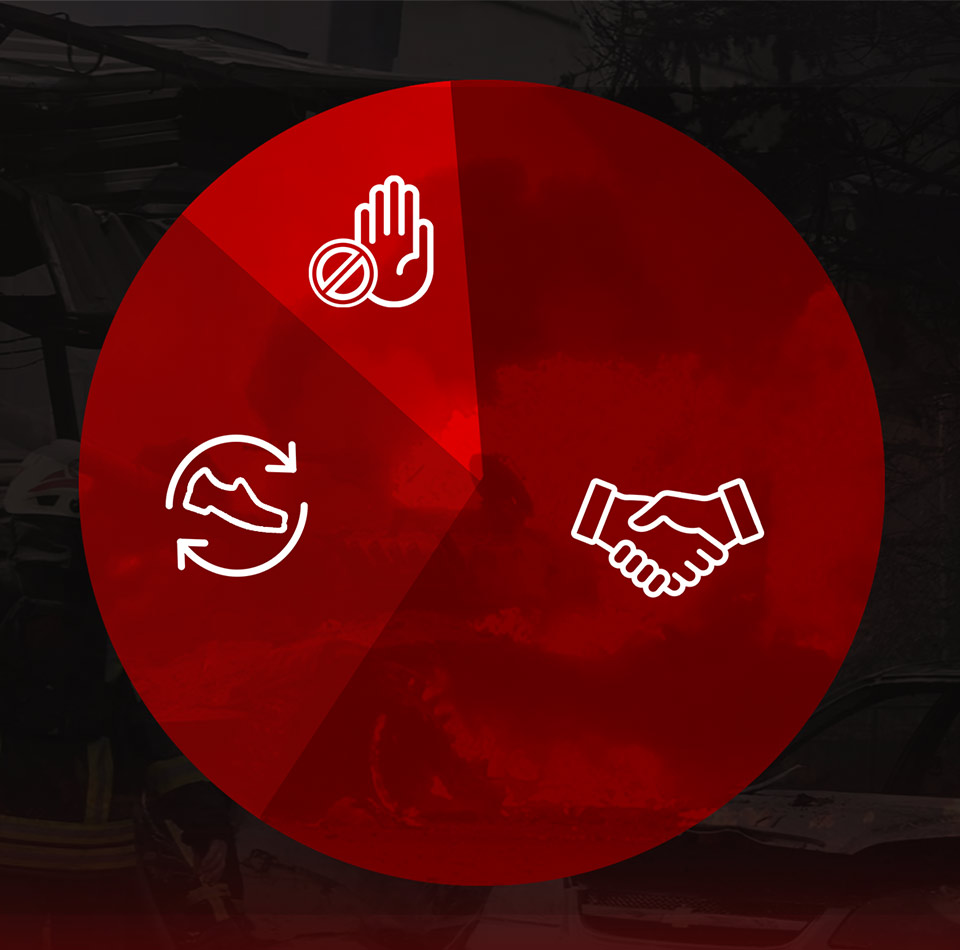
Support the war (45.6%)
These are companies that continue to operate in Russia, pay taxes, have not made significant attempts to exit the market, or are even increasing their presence there. In fact, these companies directly or indirectly support the economy of the aggressor country.
Bypass (35.4%)
These are companies that have formally announced a “stop” or “reduction” of operations in Russia, but in practice have found ways to circumvent sanctions or restrictions. For example, they may sell products through intermediaries, abandon subsidiaries, or use gray schemes to preserve profits.
Changed shoes (18.9%)
These are companies that initially remained on the market or took a neutral position, but later completely withdrew from the Russian market and ceased business with Russia. They can be considered to have changed their position under pressure from society, customers, or partners.
Quantitative analysis, Statistics by status:
In total, the three categories cover 99,9% all companies that were on the Russian market at the time of the start of the large-scale war.
45,6% — this is almost half of the companies that did not change their strategy and continued to work with the Russian Federation.
35,4% — more than a third are actively looking for loopholes and circumventing sanctions.
18,9% — less than a fifth actually severed ties with the aggressor.
Conclusions and trends, Statistics by status:
Most companies are not willing to sacrifice profits — more than 80% (including those who support the war or circumvent sanctions) did not leave Russia completely.
Public and media pressure influences, but often not enough for radical change.
There is a positive example to follow: almost 19% companies nevertheless morally and economically supported Ukraine.
Why is this important:
Companies determine through their actions:
– the real effectiveness of sanctions,
– economic pressure on the aggressor,
– Western business values,
– brand image in the world (reputational risks).
*If you found the answer to your question, support our volunteer project by subscribing or donating:
One-time donation to the bank
Monthly subscription
Detailed statistics
We are expanding the space where numbers and facts are transformed into real tools of influence for everyone who does not want to finance war through their purchases. Statistics are built around interactive graphs that do not just illustrate, but literally “chew” for the user: who, where, when and in what area still supports the aggressor country.


