Decoding of categories, Statistics by country:
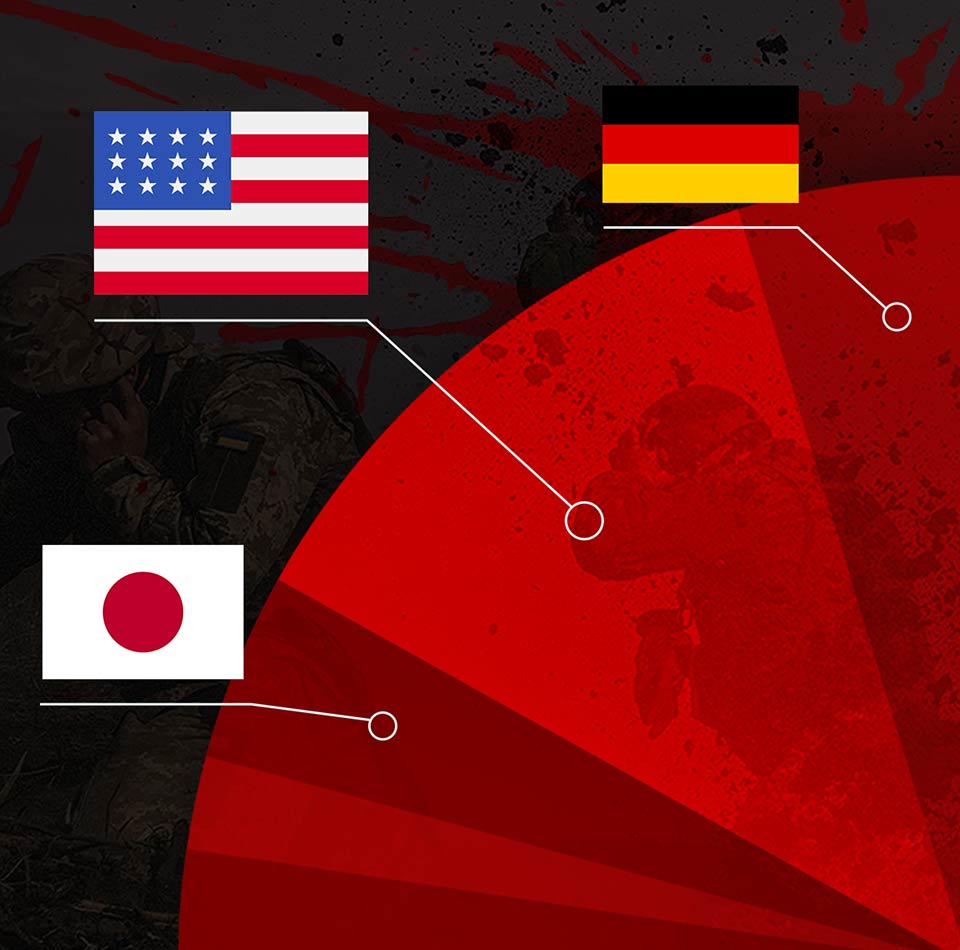
The data presented is the percentage distribution of companies by country of origin that have business in Russia. The data is summarized for 27 countries, the total share is 100%. This information can be used to understand the geographical distribution of international business in the Russian market.
Quantitative analysis, Statistics by country:
Top 5 countries by share of companies in the Russian market
USA – the largest share (19%), reflecting the significant presence of American companies.
France – the second largest share (13.4%).
Germany – third place (10.9%).
Italy – fourth position (9.6%).
China – fifth position (5.1%).
Together, these five countries form more than half (58%) of all companies on the Russian market.
Countries with a low share (less than 2%)
This group includes the Scandinavian countries (Sweden — 1.6%, Finland — 1.3%, Denmark — 1.2%), as well as Latvia, Estonia, Serbia, Qatar, etc.
Conclusions and trends, Statistics by country:
– A large proportion of American companies (19%) indicates significant US economic influence in Russia.
– France, Germany and Italy together account for over 34%, indicating a significant presence of European companies.
– China ranks fifth (5.1%), demonstrating strategic interest in the Russian market.
In total, the countries represented cover the entire spectrum of international business in Russia.
This data allows us to understand the potential influence and role of each country in the context of sanctions and support for Ukraine.
Why is this important:
– The share of companies from a particular country reflects its economic influence on Russia.
– A significant part of these companies either supports the war (while remaining in Russia) or circumvents sanctions.
– For business, this is an indicator of reputational risks and responsibility to the global community.
*If you found the answer to your question, support our volunteer project by subscribing or donating:
One-time donation to the bank
Monthly subscription
Detailed statistics
We are expanding the space where numbers and facts are transformed into real tools of influence for everyone who does not want to finance war through their purchases. Statistics are built around interactive graphs that do not just illustrate, but literally “chew” for the user: who, where, when and in what area still supports the aggressor country.


